
Air pollution, simplified
Researchers from CMU’s College of Engineering are part of a collaboration that has created easy-to-use tools to estimate the societal costs of air pollution.
You might hear an old-timer say “things were simpler then” when reminiscing about the past. That sentiment applies to the vexing choice of what show to stream next, but for estimating the economic and health impacts of air pollution, it does not. “Back in the day” was so complicated that most researchers were unable to do such estimations. Those who could mostly didn’t.
Researchers from CMU’s College of Engineering, however, are part of a collaboration that has begun to change that, by creating easy-to-use tools to estimate the societal costs of air pollution. Published recently in the journal Environmental Research Letters, a new study compares these tools, called “reduced complexity models” (RCMs), and verifies that they can be used to give accurate estimates. And, importantly, the tools are simple enough to use that a much broader community—from city planners to citizens’ groups, state regulators to affected industries—will have access to estimating the social costs of air pollution.
The team, which also includes collaborators from Clark University, University of Washington, and University of Minnesota, compared three different RCMs to one another and to a more complex modeling technique serving as the “ground truth.” The results were so encouraging to Peter Adams, Interim Head of the Department of Engineering and Public Policy and lead author of the study, that he says “RCMs are ready for primetime.”
Source: College of Engineering
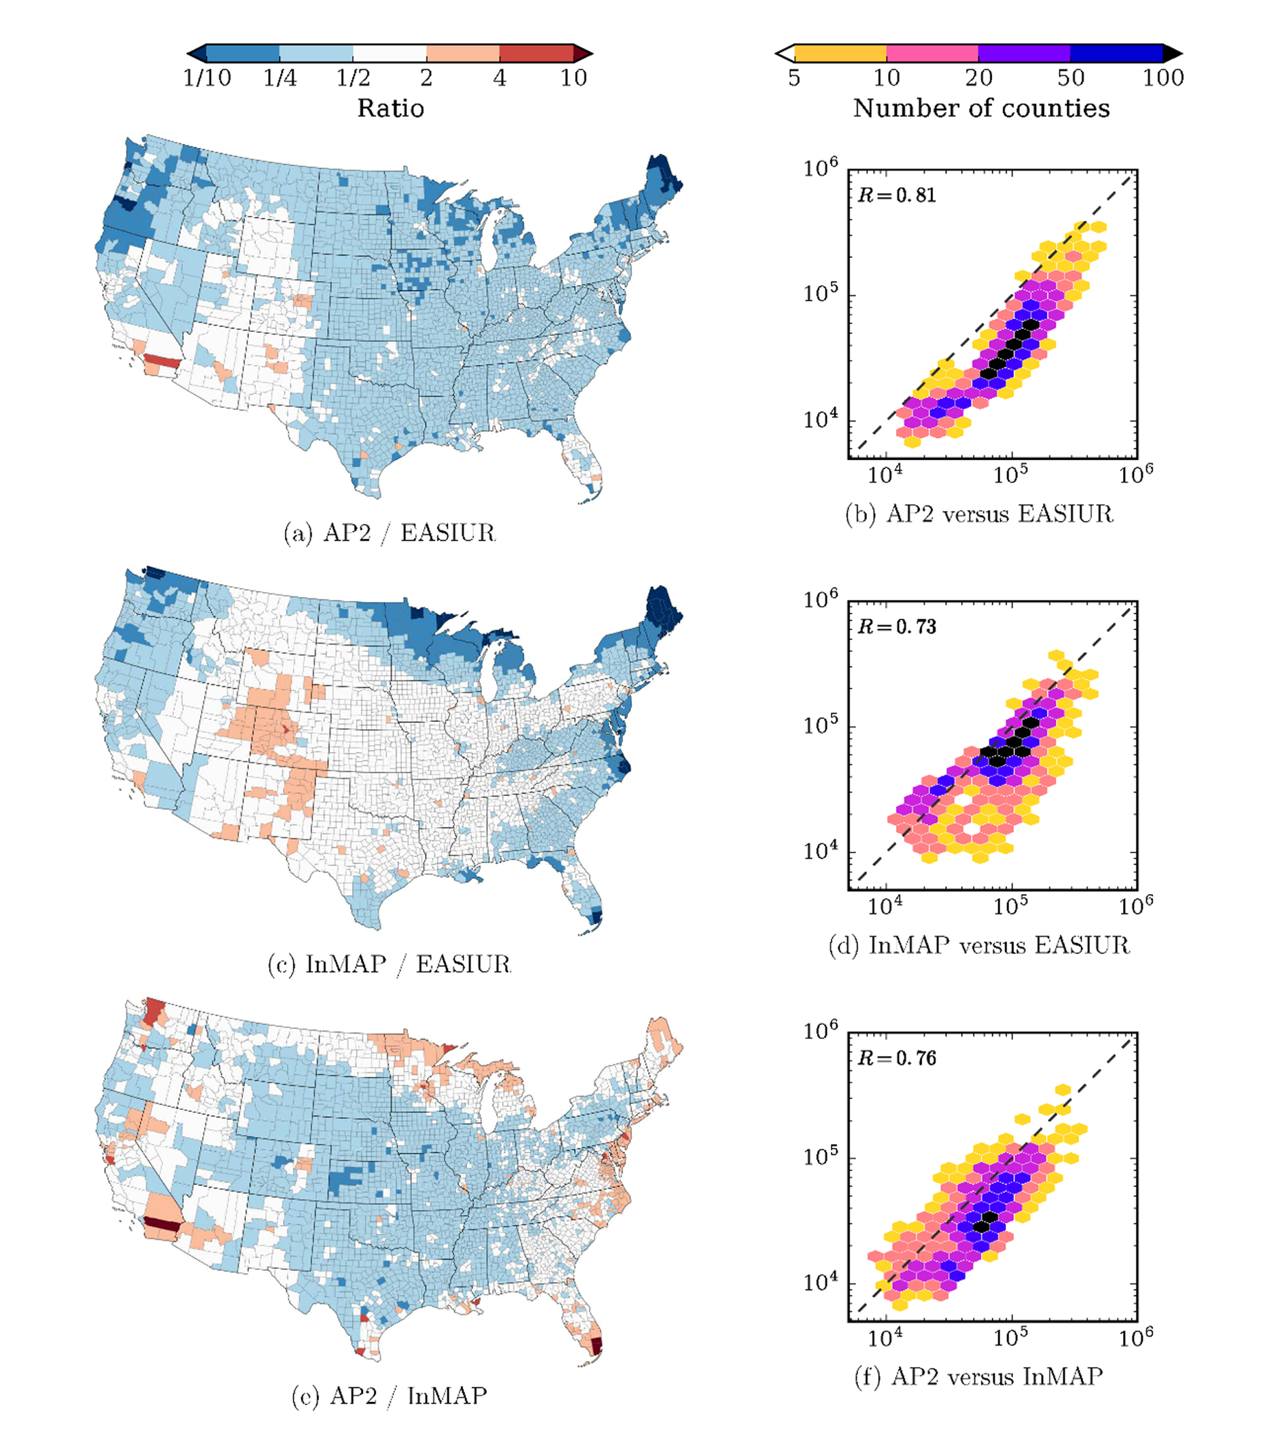
Comparison of marginal social costs from primary PM2.5 for ground-level emissions. Maps show the ratio of social cost estimates for each model pair, with white areas indicating agreement within a factor of two. The plots show social costs of emissions by county to indicate overall model agreement.
“For the purpose of recommending policy decisions, the differences between RCMs were small enough that they would recommend the same course of action,” said Adams.
Consider a societal change likely to affect air pollution, like the energy transition underway in the U.S. power sector. What will happen to air pollution exposures in the eastern U.S. as falling energy prices cause high-emitting coal plants to be retired early? Who will breathe the resulting cleaner air, how much cleaner will it be, how many lives may be saved, and what economic impact will that have? This example is far from abstract; it is playing out currently in this country and other parts of the world.
A decade ago, Adams and his graduate students were some of a select few researchers who could readily address such questions. An expert in building and running chemical transport models (CTMs), the gold-standard method for estimating air pollution concentrations, Adams was able to predict ambient pollution levels and how those levels might change under different emissions scenarios, like burning less coal.
These gold-standard CTMs, however, required implementing thousands of equations in a computer program to describe the complex processing of pollutants released to the atmosphere. Building such models took months or years just to design, and weeks for a supercomputer to crunch through the numbers. “You had to hope you didn’t have some bug in your code, because you wouldn’t find out for two weeks,” said Adams.
The information contained in CTMs is of interest to many groups, but few have the expertise and time required to use them. “RCMs are not meant to replace CTMs. They're for all the people that will never run a CTM,” Adams said. Even for air quality researchers that do use CTMs, RCMs can be preferable when they want to quickly explore a broad range of emissions scenarios.
Over the past decade, a few separate research teams have worked to make such tools available. Adams, an air quality engineer, developed the “EASIUR” model (pronounced “easier”). Nick Muller, a professor of engineering and public policy and the Tepper School, developed his own RCM (“APEEP”) at a previous institution. Scientists from the University of Washington (UW) developed “InMAP,” another RCM.
The inner workings of each model are different, but fundamentally they all do the same important thing: connect changes in emissions to changes in atmospheric concentrations without having to use a CTM.
Now, these different research teams have come together under the collaborative CACES group (Center for Air, Climate, and Energy Solutions) to test their models against one another, and make their models accessible to anyone wanting to use them.
In short, said Adams of the team’s comparisons, the models work. Each RCM compared well to the ground-truth CTM. As stated in the paper, “that different independent methods converged on similar results bolsters confidence.” While RCMs do introduce some uncertainty in air pollution estimates compared to a CTM, the uncertainty is not large in the context of other uncertainties associated with estimating social costs.
“We’re at the point where you can now go to our website, download RCM results, and in an afternoon of spreadsheet work start to estimate social costs,” said Adams. “Nobody should do an energy-systems analysis anymore where they stop their analysis at changes in emissions. It’s now easy to estimate the health costs or benefits.”
The utility of these RCMs has been demonstrated many times just this year. Using APEEP, Muller recently estimated the negative economic impact (“damages”) from rising levels of particulate matter in the U.S. from 2016 to 2018, a reversal of the previous decade’s decline. According to that research, almost 10,000 premature deaths can be attributed to the increase. In another recent study, he quantified the damages from different air pollutants across each sector of the U.S. economy. UW researchers, using InMAP, recently showed how exposure to air pollution from power generation is distributed differently across racial groups and income levels across the U.S. CTMs will still be used for the most accurate predictions of air pollution concentrations, but RCMs can shine in considering many different scenarios due to their comparative simplicity and speed.
Unaffiliated research groups have begun using these RCMs too, and Adams hopes more will follow. The CACES open-source data website makes evaluating air quality impacts quick and easy at spatial scales even finer than city neighborhoods.
Using RCMs, as the insights above show, meaningfully furthers our understanding of the impact of air pollution on society, and this latest study should bolster confidence in their accuracy. The proof of the pudding is in the modeling; something that anyone with Excel and an afternoon can now do.